
Price Your Next Inspection Like a Pro.
Use the free calculator below to find a profitable, market-backed inspection fee for any property — based on Spectora data, regional benchmarks, and your real business costs.
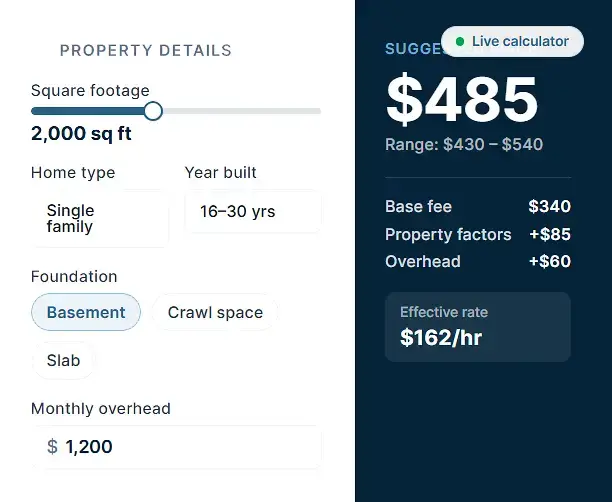
How the Calculator Works
Toggle services you offer. Prices are market-rate ranges — adjust in your quoting to your local market.
What does it cost to keep your business running each month? Include insurance, software, vehicle, marketing, phone, and any other recurring costs.
Not sure? $1,200 is the typical floor for a new solo inspector.
Why Pricing Right Matters
A few dollars per inspection compounds into thousands a year. Set your prices based on value.
-
Stop leaving money on the table
Most solo inspectors undercharge for the exact same work. Small corrections add up fast over a season.
-
Win the jobs worth winning
The right price signals the value you deliver. Buyers pay for peace of mind — price accordingly.
-
Price from cost, not competitors
Start with what it costs to run your business, then add profit — never work backward from the cheapest guy in town.
-
Charge for every add-on
Radon, sewer scope, pool — each should stand alone as a profitable service, not a throw-in.
READY TO RUN A SHARPER BUSINESS?
Price It Right — Then Deliver Like a Pro
Spectora gives you online scheduling, on-site reporting, modern report delivery, and built-in payments. Try it free, no credit card required to start.
Sign up only takes a few moments.
This tool provides estimates for educational and informational purposes only. Suggested prices are based on aggregated market data and industry benchmarks and are not a guarantee of profitability, accuracy, or prevailing rates in your specific market. Your actual pricing should reflect your local market, experience, insurance, licensing, equipment, and full business costs. Spectora does not provide financial, legal, or business advice. Always validate the output against your own numbers before quoting a client.